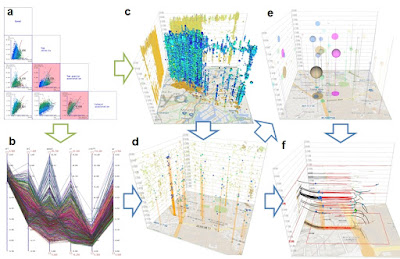
Overview of our environment for exploring caution spots from vehicle recorder data. (a) Standard Exploration View: Scatter plot matrix based exploration interface for a standard line of degree of caution. The degree of caution for each operation log is calculated based on the standard line of the degree of caution and visualized in (b) a parallel coordinates view (PCV) and in (c) 3D spatio-temporal visualization space (3DSTV). (d) Users can filter out plots in 3DSTV based on degree-of-caution values by using PCV. (e) Visualized plots can be aggregated to help find caution spots. (f) Movement paths related to selected plots in the caution spots can be visualized to explore them in detail.
ドライブレコーダデータからの危険領域探索
交通事故を予防するために、多くの自治体が聞き込み調査等でヒヤリハット地図を作成しているが、広い範囲における時間まで考慮したヒヤリハット地図を作成することは従来困難であった。近年、運送会社などでは安全運転促進の目的でドライブレコーダを導入し、多くの操作ログが利用可能になりつつある。ドライブレコーダのデータを用いることにより、どの場所で、どの時間帯にどのような運転操作が発生するか解析可能になる。そこで我々は、ドライブレコーダデータに含まれるハンドル操作やブレーキ操作などの操作ログを時空間的に探索し、そこから要注意領域を発見するための可視化・探索インタフェースを提案した。インタラクティブな3 次元可視化時空間を用いることにより、詳細な情報が探索可能になる。実データとして、大手運送会社のドライブレコーダデータを用いて検証を行った。
■References
- 横山大作、伊藤正彦、豊田正史,ドライブレコーダデータを利用した運転者ごとの挙動傾向把握の試み,日本データベース学会和文論文誌, Vol.14-J, Article No.11, Mar.2016.
- Masahiko Itoh, Daisaku Yokoyama, Masashi Toyoda, and Masaru Kitsuregawa, Visual Interface for Exploring Caution Spots from Vehicle Recorder Big Data, In Proceedings of the IEEE BigData 2015, pp.776-784, Oct. 2015
- Masahiko Itoh, Daisaku Yokoyama, Masashi Toyoda, and Masaru Kitsuregawa, A System for Visual Exploration of Caution Spots from Vehicle Recorder Data, In Proceedings of IEEE Conference on Visual Analytics Science and Technology (VAST 2015), Oct. 2015, (poster)
- 小矢島諒, 豊田正史, 横山大作, 伊藤正彦, ドライブレコーダデータと道路特徴を併用した潜在リスク箇所の判別に向けて,第8回データ工学と情報マネジメントに関するフォーラム(DEIM2016),Feb-Mar. 2015
- 伊藤正彦,横山大作,豊田正史, 3次元時空間可視化によるドライブレコーダデータからの危険領域探索,第7回データ工学と情報マネジメントに関するフォーラム(DEIM2015),Mar. 2015
- 横山大作,伊藤正彦, 豊田正史, ドライブレコーダデータを利用した運転者ごとの挙動傾向把握の試み, 第7回データ工学と情報マネジメントに関するフォーラム(DEIM2015),Mar. 2015
