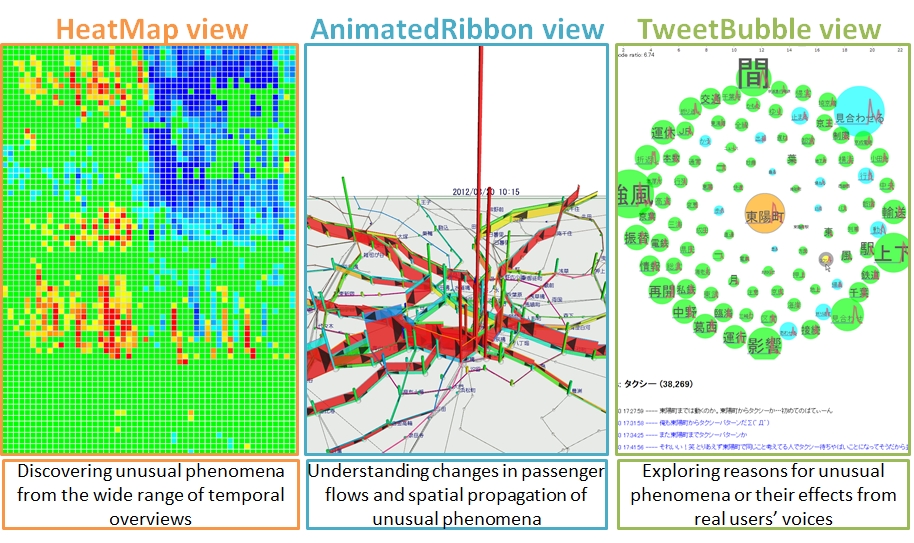
- HeatMap view provides a temporal overview of unusual phenomena in passenger flows.
- AnimatedRibbon view visualizes temporal changes in passenger flows with spatial contexts and propagation of unusual phenomena over the whole metro network using animation.
- TweetBubble view provides an overview of trends of keywords explaining the situation during the unusual phenomena.
We demonstrate the possibilities and usefulness of our novel visualization environment using a series of real data case studies and domain experts’ feedbacks about various kinds of events.
■Case Study 1: The Great East Japan Earthquake
AnimatedRibbon view visualizes passenger flows on 11 Mar. 2011, the day on which the Great East Japan Earthquake occurred.
Earthquake occurred at 14:46. Just after the earthquake, almost all lines suspended operation. Tokyo Metro Ginza Line and part of Hanzomon Line resumed at 20:40. We can find a huge number of people were concentrated on the Ginza Line to move to Shibuya station.
Next, a TweetBubble view related to the Ginza Line is opend. Filtring small nodes, and selecting time window. Then, some representative keywords appear such as working or resuming. Now he select the keyword Resuming, then original tweets related to Resuming appear.
■Case Study 2: Spring Storm April 2012
A spring storm that had the same intensity as a typhoon hit the Japanese mainland on 3 April 2012. Many companies in Tokyo urged employees to go home early that day.
Next movie shows an eastern area of Tokyo in the Spring storm day. Tozai Line became very crowded before the normal rush hours. Because many companies said you should go back home early. Then, the power of passenger flows rapidly decreased. We can find many passengers exited Toyocho station, and passengers started to use Toei Shinjuku Line to move to eastern area.
So what happened? Now, we selects Toyocho station and open TweetBubble view Here, we can find some representative keywords, and select “suspend”.
So, we can understand the reasons for decrease in the size of passenger flows, and a reason for increase in the number of passenger exiting Toyocho station. These also include keywords such as taxi, bus. For example, we select taxi. By observing these words, we can find passengers’ real behavior; how they traveled from Toyocho to their destinations.
■Case Study 3: Fire at Yurakucho on 3 Jan. 2014
On Jan. 3 2014, big fire happened near Yurakucho station. It caused suspension of JR Yamanote Line. JR Yamanote Line is loop line, it accesses to many important stations in Tokyo and connects to many other transportation services. From HeatMap view, we can find some lines have huge red area after 10 o’clock. Now, we select such lines.
In the AnimatedRibbon view, we can observe many passengers changed their routes to their destinations mainly by using the Fukutoshin Line, Marunouchi Line, and Chiyoda Line.
Next, we select Fukutoshin Line and opens TweetBubble view, and selects a keyword “JR Yamanote Line”. From the tweets, we can understand that many passengers said “If the JR Yamanote Line suspended operation, they would switch to the Metro Fuskutoshin Line in place of the JR Yamanote Line”.
■Case Study 4: A Parade by London Olympic Medalists in Ginza
A Parade by London Olympic Medalists held in Ginza on August 20, 2012 Almost 500,000 people gathered in Ginza for the 20 minutes parade. This result shows a massive amount of people gathered in Ginza from various quarters in Tokyo before the parade started and just after the parade ended, they quickly left from Ginza.
■References
- Masahiko Itoh, Daisaku Yokoyama, Masashi Toyoda, Yoshimitsu Tomita, Satoshi Kawamura, Masaru Kitsuregawa,Visual Exploration of Changes in Passenger Flows and Tweets on Mega-City Metro Network, IEEE Transactions on Big Data, vol.2, no. 1, pp. 85-99, Mar. 2016
- Satoshi Kawamura, Yoshimitsu Tomita, Masahiko Itoh, Daisaku Yokoyama, Masashi Toyoda, and Masaru Kitsuregawa, An Effective Use of Tokyo Metro Passengers Flow by Visualization of Smart Card Ticket ’PASMO’ Origin-Destination Data for Public Transport Network to be Sustainable, In Proceedings of the World Engineering Conference and Convention (WECC 2015), Nov-Dec. 2015
- Masahiko Itoh, Daisaku Yokoyama, Masashi Toyoda, Yoshimitsu Tomita, Satoshi Kawamura, and Masaru Kitsuregawa, Visual Fusion of Mega-City Big Data: An Application to Traffic and Tweets Data Analysis of Metro Passengers, In Proceedings of the IEEE BigData 2014, pp.431-440, Oct. 2014
- Daisaku Yokoyama, Masahiko Itoh, Masashi Toyoda, Yoshimitsu Tomita, Satoshi Kawamura, and Masaru Kitsuregawa, A Framework for Large-Scale Train Trip Record Analysis and Its Application to Passengers' Flow Prediction after Train Accidents, In Proceedings of the Pacific-Asia Conference on Knowledge Discovery and Data Mining (PAKDD 2014), pp. 533-544, May.2014
- Masahiko Itoh, Daisaku Yokoyama, Masashi Toyoda, Yoshimitsu Tomita, Satoshi Kawamura and Masaru Kitsuregawa, Visualization of Passenger Flows on Metro, In Proceedings of IEEE Conference on Visual Analytics Science and Technology (VAST 2013), Oct. 2013, (poster)