We propose an interactive framework for the 3D visualization of the time-series of Web graphs. The purpose of our framework is to enable users to examine the evolution of Web graphs by comparing multiple graphs that have different timings and topics. To achieve this, we provide TimeSlices that are 2D planes to visualize Web graphs in a 3D environment. Users can interactively add new TimeSlices along the timeline, and they can manipulate them to animate Web graphs. Moreover, we provide mechanisms to generate and manipulate overlay views and parallel views in the 3D environment to enable Web graphs to be compared. Users can seamlessly change these viewing modes. This system enables us to observe structural and temporal changes in multiple Web graphs such as shifts in influential blogs or power shifts in the diffusion of blogs between topics.
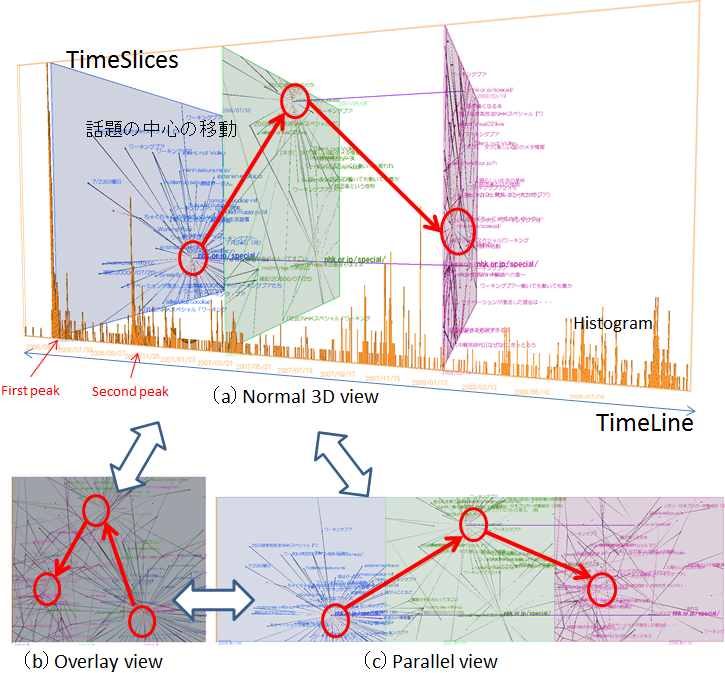
Example shows the example using our framework. We can see that many people wrote their opinions on the blog after the TV program called the "working poor" had been broadcast. Most of their blogs were linked to the official page of the TV program. The second peak appeared after the sequel "working poor II" had been broadcast. We can find the center shifts in focus from the official pages of "working poor" to "working poor II". We can see that many clusters have spread and the term "working poor" has become popular after these two peaks. We can also see the variety in topics in these clusters. These are derived from or related to the term "working poor".
時系列情報をもつウェブグラフの対話的3次元可視化
本システムはWebアーカイブから抽出された特定の話題に関するリンク構造を表すWebグラフを3次元空間中の時間軸に沿って可視化する。ある時間のWebグラフを表示するパネルをTimeSlice と呼ぶ。ユーザはTimeSlice をマウスでドラッグすることでグラフの変化をアニメーションさせながら任意の時間におけるグラフを閲覧することができる。TimeSliceの側面には文書数を表すヒストグラムが表示されており、急激な増加など特徴的な変化が起きた時点でのグラフを容易に表示することが可能である。また、異なる時間のWebグラフを比較するため、新たなTimeSliceを自由に追加することが出来る。これにより、Web上の話題に関する話題の中心、興味の広がり等の時系列変化を把握可能とした。さらに、より詳細な比較を可能にするタイル表示および重畳表示手法を3次元空間で統合し、これらをシームレスに切り替え可能にした。これらにより、ユーザは変化の全体像を俯瞰しながら、より局所的な変化の詳細を観測することが可能になった。
上図にブログ空間上における「ワーキングプア」に関連する人々の興味の移り変わりを可視化した例を示す。ワーキングプア問題を広めるきっかけとなったNHKの番組にリンクが集中している様子が見て取れ、1回目、2回目の放送に伴って、話題の中心が移動している様子が観測できる。
■References
- Masahiko Itoh, Masashi Toyoda, and Masaru Kitsuregawa, An Interactive Visualization Framework for Time-series of Web graphs in a 3D Environment, In Proceedings of the 14th International Conference on Information Visualization (IV 2010), pp. 54-60, IEEE, Jul. 2010, (paper)
- 伊藤正彦,豊田正史,喜連川優, TimeSlices: 時系列情報をもつウェブグラフの対話的3次元可視化, 第17回インタラクティブシステムとソフトウェアに関するワークショップ (WISS 2009), pp. 141-142, Dec. 2009, (poster)